I. Overall Review [1]
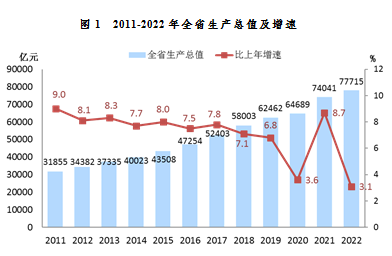
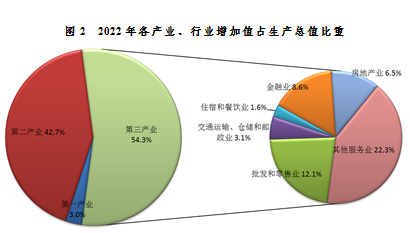
According to the national preliminary accounting, the gross domestic product of the province in 2022 was 7,771.5 billion yuan[2], an increase of 3.1% over the previous year. In terms of industries, the added value of the primary, secondary, and tertiary industries was respectively 232.5 billion yuan, 332.5 billion yuan, and 4218.5 billion yuan, an increase of 3.2%, 3.4%, and 2.8% compared to the previous year. The three industrial structures were 3.0:42.7:54.3. The per capita GDP was 118,496 yuan (about US $17,617 at the annual average exchange rate), an increase of 2.2% over the previous year.
According to a sample survey of 5 ‰ population change in the province in 2022, the province's permanent resident population at the end of the year was 65.77 million, an increase of 370,000 compared to the end of the previous year. Among them, the male population is 34.36 million and the female population is 31.41 million, accounting for 52.2% and 47.8% of the total population, respectively. The annual birth population was 412,000, with a birth rate of 6.28 ‰. The dead population is 409,000, with a mortality rate of 6.24 ‰. The natural growth rate is 0.04 ‰. The urbanization rate was 73.4%.
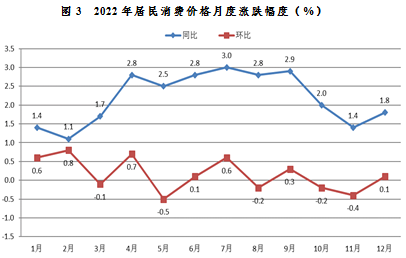
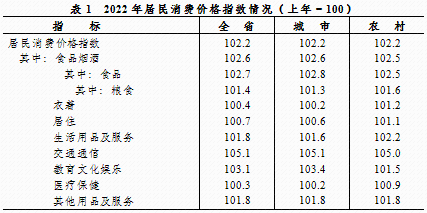
The annual consumer price of residents increased by 2.2% compared to the previous year, with food prices rising by 2.7%. Urban consumer prices rose by 2.2%, while rural consumer prices rose by 2.2%. Consumer goods prices rose by 3.0% and service prices rose by 1.0%. Retail prices of goods rose by 3.2%. The factory price of industrial producers increased by 4.0% and the purchase price of industrial producers increased by 6.1% throughout the year.
At the end of the year, 39.3 million people were employed [3], an increase of 0.8% over the previous year, accounting for 59.8% of the permanent resident population. 128,000 people in difficult situations were helped to obtain employment, and the unemployment rate in urban surveys is below the control target of 5.5%. The total number of migrant workers was 13.68 million, an increase of 2.1%.
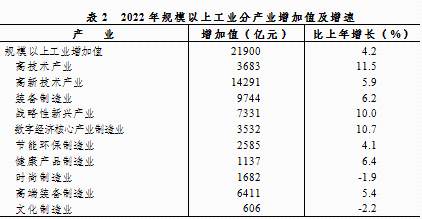
New drivers continue to lead growth. The economic added value of new industries, new formats, and new models throughout the year accounted for 28.1% of GDP. The added value of core industries in the digital economy was 897.7 billion yuan, an increase of 6.3% over the previous year. The added value of the manufacturing industry, the core industry of the digital economy, increased by 10.7%, 6.5 % higher than that of industries above designated size(ADS), and drove the added value of ADS industries to increase by 1.7%. The added value of high-tech industries, strategic emerging industries, equipment industries, and high-tech industries increased by 11.5%, 10.0%, 6.2%, and 5.9%, respectively, driving the added value of ADS industries to increase by 1.9, 3.1, 2.8, and 3.9 percent. Among strategic emerging industries, the added value of new energy, biology, new energy vehicles, and new generation information technology industries increased by 24.8%, 10.0%, 9.4%, and 9.3%, respectively.
High quality development continued to be promoted. The annual total labor productivity [4] was 1.99 million yuan per person, an increase of 2.2% over the previous year. The labor productivity of ADS industries was 296,000 yuan per person, an increase of 4.2% over the previous year. The general public budget revenue was 803.9 billion yuan, an increase of 5.5% after deducting tax rebates, ranking third in the country in total. Local government general debt revenue was 105.9 billion yuan, and transfer income was 553 billion yuan. Among them, tax revenue was 662 billion yuan, an increase of 2.0% after tax deductions and refunds, accounting for 82.3% of the general public budget revenue, and the quality of revenue ranked among the top in the country. The general public budget expenditure was 1,201.8 billion yuan, an increase of 9.1%. Among them, key expenditures on health, science and technology, social security and employment, cultural tourism, sports and media, education, agriculture, forestry, and water conservancy increased by 36.1%, 17.7%, 8.9%, 8.0%, 7.8%, and 4.5%, respectively. Among ADS industrial enterprises, 42,000 have R&D expenses, accounting for 76.6% of ADS industrial enterprises, an increase of 4.3% over the previous year. R&D expenses grew by 14.5%, 7.1% higher than operating revenue. The proportion of research and development expenses in operating revenue was 2.9%, an increase of 0.2% over the previous year. The output value of new products grew by 12.3%, contributing 67.9% to the growth of total industrial output value. The output value ratio of new products was 42.2%, 1.9% higher than the previous year.
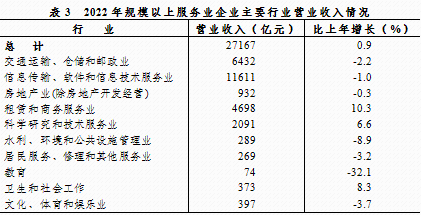
The service industry has seen progress in stability. The added value of the service industry throughout the year was 4,218.5 billion yuan, an increase of 2.8% over the previous year, driving a 1.5% increase in the province's GDP, and contributing 50.4% to economic growth. The operating revenue of ADS enterprises [5] in the service industry was 2,716.7 billion yuan, an increase of 0.9%. Of the 10 service industry sectors, 9 achieved average growth over the past two years. Among them, the operating revenue of leasing and business services, health and social work, scientific research, and technical services increased by 10.3%, 8.3%, and 6.6% respectively over the previous year. The average operating income of service enterprises above designated size is 210 million yuan per enterprise. There are a total of 315 enterprises with an annual operating revenue of over 1 billion yuan, an increase of 11 over the previous year, accounting for 2.4% of the number of ADS enterprises in service industry. The operating revenue accounts for 63.5%, contributing 43.6% to the growth of service industry operating revenue in the province, driving the growth of service industry operating revenue in the province by 0.4%.
The vitality of the private economy has increased. The added value of private economy accounted for 67% of the province's GDP throughout the year. The number of private enterprises in ASD industries has exceeded 50,000, accounting for 92.2%; the added value exceeded 1.5 trillion yuan, accounting for 70.3%; the growth rate is 5.2%, which is 1.0 percent higher than that of ADS industries, contributing 83.2% to the added value growth of ADS industries. The operating revenue of ADS private enterprises in the service industry increased by 2.0%, with a growth rate 1.1 percent higher than that of the ADS service industry. Private investment accounted for 56.4% of the total fixed assets investment. The import and export of private enterprises increased by 16.9%, accounting for 78.3% of the province, driving the province's import and export growth by 12.8 percent. There are 9.43 million registered market entities, an increase of 8.6% compared to the previous year. There are 460,000 newly established private enterprises, accounting for 93.5% of the total number of newly established enterprises. There are 3.08 million private enterprises, accounting for 92.5% of the total number of enterprises. The tax revenue generated by private economy accounts for 71.7% of the province's tax revenue.
II. Agriculture and Rural Areas
Stable production and supply of major agricultural products. The annual grain planting area was 102,000 hectares, an increase of 1.4% compared to the previous year, and the total yield was 6.21 million tons, which was basically the same as the previous year; the rapeseed covered 124,000 hectares, an increase of 3.4%; vegetables covered 671,000 hectares, an increase of 1.0%; TCM herbs covered 466,000 hectares, a decrease of 1.6%; fruits and melons covered 837,000 hectares, a decrease of 4.5%. The total production of pigs, cattle, sheep, and poultry meat reached 1.08 million tons, an increase of 4.8%; the production of pork reached 714,000 tons, an increase of 9.6%; the production of poultry eggs reached 317,000 tons, an increase of 2.5%; the milk production reached 196,000 tons, an increase of 5.7%. The total production of aquatic products reached 6.48 million tons, an increase of 3.6%, among which the production of seawater products was 5.01 million tons, an increase of 3.6%; the production of freshwater products reached 1.47 million tons, an increase of 3.5%. At the end of the year, there were 6.44 million pigs on hand, an increase of 0.7%; among them, there were 711,000 progenitive sows, an increase of 2.6%. Throughout the year, 8.51 million pigs were sold, an increase of 9.9%.
Significant results produced in the modernization of agriculture. We promoted high standard construction of modern agricultural parks and grain production zones. A total of 90 provincial-level modern agricultural parks were established, and 8.1 million mu of grain production functional zones protected. A total of 138 pig farms with a production capacity of 7.48 million were built. The comprehensive mechanization rate for crop cultivation and harvest reached over 76.5% in the province, among which the rate for rice cultivation and harvest was over 85.5%. 83 new provincial-approved agricultural varieties were developed, 97 new varieties were promoted, and the improved varieties covered 98%. 78 key R&D projects were implemented in the agricultural field. Throughout the year, over 450,000 tons of formula fertilizers were promoted, and the rate of soil testing and formula fertilization for major crops reached 90% in the province. 537 varieties of foods were newly accredited as green ones, and a total of 2,687 green foods were within validity period; 10 national projects were newly approved for the protection of agricultural product geographical indications, totaling 40 now; 10 provincial-level bases were built for high-quality green agricultural products, totaling 45.
Taking the lead in constructing harmonious rural areas for the new era. The "Green Village Project" was further promoted, and the annual goal of rural household waste classification and treatment was successfully completed. The practice of household waste classification covered the whole rural areas in the province, with the rate of harmless treatment reaching 100%, the recycling rate reaching 60%, and the resource utilization rate reaching 100%. 14 beautiful rural demonstration counties, 114 demonstration townships, 22 demonstration belts and 335 characteristic villages were created, and the beautiful rural areas covered 93% of the province. Throughout the year, 8,989 projects were carried out, including Future Villages, Beautiful Villages, Demonstration Belts, and Historical and Cultural Villages. The rural governance mechanism was further improved by integrating autonomy, rule of law, moral governance and intelligent governance together, and a total of 8,097 demonstration villages were built for good governance.
Common prosperity was effectively promoted for farmers and rural areas. A rich village will surely benefit the villagers. Over 85% of the administrative villages had a collective economic income of over 300,000 yuan and an operational income of over 150,000 yuan in the province. Equal public services were promoted in urban and rural areas, with 74.2% of preschoolers in primary and secondary kindergartens in rural areas, and the urban-rural compulsory education community covered all rural schools; 162 county-level medical communities and 1,249 standardized village-level medical institutions were established. A total of 1,456 home-based elderly care service centers and 22,000 community care centers were built, achieving full coverage of townships and communities; 110 village-level fitness squares were newly formed, and 8,288 "15-minute cultural circles" were established, covering the entire province. Assistance to low-income farmers was strengthened, and the annual per capita disposable income for low-income farmers increased by 14.6%, 8.0% higher than that of the farmers. 114,000 people were trained as practical talents and high-quality farmers.
III. Industry and Construction Industry
The added value of industries above designated size was 2,190 billion yuan, an increase of 4.2% compared to the previous year. In terms of economic types, the state-owned enterprises and state-owned holding enterprises increased by 4.2% compared to the previous year, foreign-invested enterprises increased by 2.9%, and Hong Kong, Macao, and Taiwan invested enterprises decreased by 1.3%.The added value of 17 traditional manufacturing industries increased by 2.4%. Among the 38 industrial categories, 19 industries saw a year-on-year increase in added value, while 8 industries showed double-digit growth. Among them, industries such as pharmaceuticals, chemical raw materials, computer communication electronics, and automobiles increased by 16.2%, 14.7%, 14.6%, and 13.7% respectively, driving a total increase of 4.1% in the added value of industries above designated size. The manufacturing industry, the core industry of digital economy, saw an added value of 353.2 billion yuan, accounting for 16.1%, and contributing 40.3% to the growth of industries above designated size. The added value contribution of high-tech, strategic emerging, and equipment industries to the growth of industries above designated size was 44.9%, 73.1%, and 67.6%, respectively. The operating revenue of industrial enterprises above designated size reached 10,795.6 billion yuan, breaking the 10 trillion yuan threshold for the first time, an increase of 7.4%.
The annual added value of the construction industry was 438.8 billion yuan, accounting for 5.6% of GDP.
IV. Fixed Assets Investment and Real Estate Industry
Fixed assets investment increased by 9.1% over the previous year. Investment in the secondary industry saw an obvious driving effect, and investment in the tertiary industry accounted for nearly 80%. The investment in the secondary industry increased by 18.9%, 9.8% higher than the total investment, accounting for 23.7%, an increase of 1.9%. The investment in the tertiary industry increased by 6.6%, accounting for 76.1%. The investment in the manufacturing industry increased by 17.0%, with a growth rate 7.9% higher than the total investment, accounting for 20.0% of the total investment and driving a 3.2% increase in total investment. Infrastructure investment increased by 7.6%, accounting for 22.9% of the total investment, driving a 1.8% increase in total investment. Among them, the investment in the industries of electricity, heat, gas, and water, and that in water conservancy, environment and public facility management (excluding land management) increased by 29.7% and 16.8%, respectively. The investment in high-tech manufacturing increased by 23.9%, while the investment in high-end manufacturing industries such as computer-communication-electronics, general equipment, pharmaceuticals, and specialized equipment increased by 35.7%, 31.4%, 30.5%, and 28.1%, respectively.
The investment in real estate development was 1,294 billion yuan in the year, an increase of 4.4% compared to the previous year, and the overall growth trend remained stable. Residential investment increased by 3.2%, driving a 2.3% increase in real estate investment; investment in office buildings increased by 15.9%; investment in commercial and business buildings decreased by 0.2%. The sales of commercial housing reached 68.15 million square meters, a decrease of 31.8% compared to the previous year. The sales volume of commercial housing decreased by 33.6%.
V. Domestic Trade
The total retail sales of consumer goods for the year amounted to 3046.7 billion yuan, an increase of 4.3% compared to the previous year, and the scale reached a new level of 3 trillion yuan for the first time. In terms of geographical location, the urban areas saw a retail sale of 2,594 billion yuan of consumer goods, an increase of 4.5%, while the rural areas recorded a retail sale of 452.7 billion yuan of consumer goods, an increase of 3.4%. By consumption type, product sales reached 2,728 billion yuan, an increase of 5.0%, while catering revenue reached 318.7 billion yuan, a decrease of 1.0%.
Among the retail sales of units above the designated size, the consumption of daily necessities, grain, oil and food, beverages, and Chinese and Western medicine steadily increased, with retail sales increasing by 4.8%, 10.2%, 10.3%, and 14.2% respectively compared to the previous year. The consumption of upgraded goods saw a rapid growth. The retail sales of cosmetics and smartphones increased by 9.0% and 8.2% respectively. The retail sales of automobiles increased by 13.7%, with new energy vehicles increasing by 1.1 times; retail sales of petroleum and petroleum products increased by 10.2%. The online retail sales of physical goods in the province reached 1,730.7 billion yuan, an increase of 9.8% compared to the previous year; the retail sales of units above the designated size increased by 19.8% through public networks.
There were 2,813 commodity trading markets in the province, with a total annual transaction volume of 2.1 trillion yuan. Among them, 262 commodity markets had an annual turnover exceeding 1 billion yuan, 41 exceeding 10 billion yuan, and 2 exceeding 100 billion yuan. In the "2022 China Commodity Market Comprehensive Top 100 List" and "China Commodity Market Top 10 Digital Leaders List" released by the Chinese Academy of Social Sciences, Zhejiang won 33 seats and 6 seats respectively, leading the country.
VI. Foreign Trade
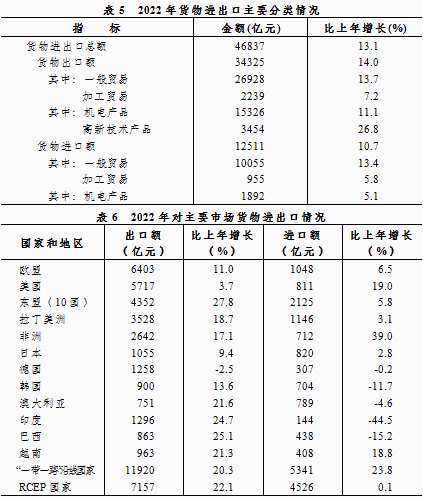
The annual import and export of goods amounted to 4,683.7 billion yuan, of which 3,432.5 billion yuan was exported and 1,251.1 billion yuan was imported, an increase of 13.1%, 14.0%, and 10.7% respectively compared to the previous year; the scale ranked third, third, and sixth in the country, accounting for 11.1%, 14.3%, and 6.9% of the national market share, respectively, an increase of 0.5, 0.4, and 0.4 percentage points compared to the previous year; the contribution rates to national growth were 18.0%, 18.5%, and 16.3%, respectively. Among them, the contribution of exports ranked first in the country, while the contribution of imports & exports, and imports ranked second in the country. The market layout continued to be optimized, with imports and exports to the European Union and the United States increasing by 10.3% and 5.4% respectively. There were 235 countries (regions) with import and export trade relations, and imports and exports to the Middle East, Africa, ASEAN, and Latin America increased by 39.3%, 21.2%, 19.6% and 14.4% respectively, all maintaining double-digit growth, driving a total of 9.1% growth in the province's foreign trade. The imports and exports to the "Belt and Road" countries and other RCEP member countries increased by 21.3% and 12.5% respectively, driving the province's foreign trade growth by 7.3% and 3.1%. The export commodity structure had been transformed and upgraded, with exports of high-tech and mechanical and electrical products increasing by 26.8% and 11.1% respectively, accounting for 10.1% and 44.7% respectively. The export growth rate of high-tech products was 12.8% higher than that of the province's exports, accounting for more than 10% for the first time.
The China-Europe (Yiwu-Xinjiang-Europe) Train runs 2,269 times. The construction of China (Zhejiang) Pilot Free Trade Zone was promoted with high quality, where 31,935 enterprises were newly registered. The 10 counties, cities and districts in the Pilot Free Trade Zone saw an increase of 11.3% in total fixed assets investment over the previous year.
Throughout the year, 2,910 foreign-invested enterprises were established, with contracted foreign investment of 43.4 billion US dollars, an increase of 12.7% compared to the previous year. The actual use of foreign investment was 19.3 billion US dollars, an increase of 5.2%. The actual use of foreign investment in the manufacturing industry reached 4.9 billion US dollars, an increase of 9.8%. There were 2,557 foreign investment projects in the tertiary industry, accounting for 87.9% of the total foreign direct investment projects. The contracted foreign investment was 36.5 billion US dollars, an increase of 29.1%, accounting for 84.0% of the total contracted foreign investment. The actual utilized foreign investment was 13.5 billion US dollars, an increase of 2.4%, accounting for 69.8% of the total actual foreign investment. A total of 934 overseas enterprises and institutions were registered and approved in the province, an increase of 16.5% compared to the previous year; the registered amount of foreign direct investment (Chinese investment) reached 13 billion US dollars, an increase of 45.0%. A total of 568 enterprises were registered (approved) in the "Belt and Road" countries and areas (including Hong Kong, Macao and Taiwan), an increase of 30.0%; the filing amount was 7.9 billion US dollars, an increase of 45.1%, accounting for 60.2% of the province's total; 293 enterprises were registered in countries that signed the RCEP agreement, an increase of 32.0%, with a filing amount of 6.3 billion US dollars, an increase of 66.1%.
VII. Transportation and Postal and Telecommunications Industry
The added value of transportation, warehousing, and postal services in the year was 237.5 billion yuan, a decrease of 1.1% compared to the previous year.
At the end of the year, the total length of highways in the province was 122,900 kilometers, including 5,289 kilometers of expressways. There are a total of 7 civil aviation airports, with an annual passenger throughput of 34.71 million people, including 17.86 million dispatched passengers. The turnover volume of railway, highway, and waterway freight is 1,354.4 billion tons per kilometer, an increase of 4.7% compared to the previous year; the passenger turnover was 49.1 billion person kilometers, a decrease of 31.2%. The cargo throughput of ports in the province [6] reached 1.92 billion tons, a decrease of 0.4%, with that of coastal ports reaching 1.54 billion tons, an increase of 3.4%. The cargo throughput of Ningbo Zhoushan Port is 1.26 billion tons, ranking first in the world for 14 consecutive years. Its container throughput is 33.35 million TEUs, ranking third in the world for 5 consecutive years, second only to Shanghai Port and Singapore Port.
At the end of the year, the total number of small passenger cars in the province was 18.52 million, including 17.1 million private cars (personal small and micro passenger cars).
The total volume of the postal and telecommunications industry continued to remain among the top in the country.
The total postal business volume [7] for the year was 218.7 billion yuan, ranking second in the country, a decrease of 2.0% compared to the previous year. The express delivery business volume is 22.9 billion pieces, an increase of 0.5% compared to the previous year, accounting for 20.7% of the national proportion. The total telecommunications business [8] for the year was 112.2 billion yuan, ranking third in the country, an increase of 19.5%. There were 90.24 million mobile phone users, an increase of 1.64 million compared to the previous year, with a penetration rate of 138.0 pieces/100 people, ranking third in the country, an increase of 0.8 pieces/100 people compared to the end of the previous year. Among them, the number of 5G mobile phone users reached 32.63 million, accounting for 36.2% of mobile phone users, an increase of 23.9% compared to the end of the previous year. The total number of 5G base stations [9] reached 171,000, with 26.2 5G base stations per 10,000 people. Except for Beijing, Shanghai and Tianjin, it ranks first among the provinces (regions) of China. Fixed Internet broadband access users reached 34 million, an increase of 2.83 million compared to the previous year, with a penetration rate of 52.0%, ranking second in the country.
VIII. Finance, Securities, and Insurance
At the end of the year, the balance of domestic and foreign currency deposits in all financial institutions was 19,634 billion yuan, an increase of 14.9% compared to the end of the previous year, of which the balance of RMB deposits increased by 15.5%. The balance of local and foreign currency deposits among households reached 8,224.2 billion yuan, an increase of 21.9%. The balance of domestic and foreign currency loans from all financial institutions reached 18,980.8 billion yuan, an increase of 14.5%, with the balance of RMB loans increasing by 14.7%. At the end of the year, the balance of RMB loans from major rural financial institutions (rural credit cooperatives, rural cooperative banks, and rural commercial banks) was 2,899.1 billion yuan, an increase of 467.4 billion yuan compared to the beginning of the year.
At the end of the year, there were 657 domestic listed companies, with a total financing of 1,788.7 billion yuan. Among them, there were 444 enterprises on the Main Stock Market, accounting for 13.9% of the total number in China, ranking second in the country; there were 156 enterprises on the ChiNext Market, accounting for 12.7% of the total number in China, ranking third in the country; there were 43 companies in the Science and Technology Innovation Market, accounting for 8.6% of the total number in China, ranking fifth in the country; there were 14 listed companies on the Beijing Stock Exchange, accounting for 8.6% of the total number in China, ranking fourth in the country. There were 608 new third board listed enterprises, accounting for 9.2% of the total number in China, ranking fourth in the country.
The annual premium income of the insurance industry was 312.9 billion yuan, an increase of 9.4% compared to the previous year. Among them, property insurance premium income was 101 billion yuan, an increase of 9.7%; the life insurance premium income was 211.9 billion yuan, an increase of 9.3%. Various types of compensations amounted to 107.6 billion yuan, an increase of 4.5%. Among them, property insurance compensation was 63.7 billion yuan, and life insurance compensation was 43.8 billion yuan.
IX. People's Livelihood and Social Security
According to the urban-rural integrated household survey, the per capita disposable income of all and urban and rural residents was 60,302 yuan, 71,268 yuan, and 37,565 yuan, respectively, an increase of 4.8%, 4.1%, and 6.6% compared to the previous year; excluding price factors, the actual growth rate is 2.5%, 1.9%, and 4.3%. The urban-rural income ratio was 1.90, a decrease of 0.04 compared to the previous year. The per capita disposable income of low-income farmers in the province was 18,899 yuan, of which the per capita disposable income of low-income farmers in 26 counties of mountainous areas is 17,329 yuan, an increase of 15.8% compared to the previous year, and the growth rate is 1.2% higher than the average level of low-income farmers in the province.
The per capita living expenses of residents were 38,971 yuan in the year, an increase of 6.3% compared to the previous year, and an increase of 4.0% after deducting price factors. According to permanent residence, the per capita living consumption expenditure of urban residents was 44,511 yuan, an increase of 5.5%, while the per capita living consumption expenditure of rural residents was 27,483 yuan, an increase of 8.1%. Excluding price factors, the per capita living consumption expenditure increased by 3.2% and 5.8%, respectively.
By the end of the year, 45.2 million people in the province had participated in basic pension insurance, 55.77 million people participated in basic medical insurance, 18.51 million people in unemployment insurance, 27.67 million people in work injury insurance, and 21.86 million people in maternity insurance. The minimum standard for basic pension of urban and rural residents' pension insurance was raised to 190 yuan/month.
At the end of the year, there were 564,000 registered recipients of subsistence allowances, including 56,800 in urban areas and 507,000 in rural areas. The annual expenditure on subsistence allowances (including various subsidies) was 6.14 billion yuan, a decrease of 13.2% compared to the previous year; the standard for urban and rural subsistence allowances is the same, averaging 1,083 yuan per person per month. Throughout the year, 12.44 billion yuan of various welfare lottery tickets were issued, an increase of 810 million yuan over the previous year, and 3.75 billion yuan of public welfare fund was raised.
X. Education and Science and Technology
By the end of the year, there were a total of 7,709 kindergartens in the province, with 1.973 million children in the kindergartens, a decrease of 1.8% compared to the previous year. There were a total of 3,204 primary schools with an enrollment of 662,000 students; there were 3.931 million students on campus, an increase of 2.5%, and the enrollment rate of primary school age children was 99.99%. 99.4% of primary schools had a building area of 10.8 square meters per student, an average of 35 books per student, and a sports stadium (gymnasium) area that meets the standards. There were 1,782 middle schools with a total enrollment of 576,000 students; there were 1.693 million students on campus, an increase of 29,200 compared to last year, and the middle school enrollment rate was 99.99%. 99.6% of middle schools had a building area of 24 square meters per student, 92 books per student, and a sports stadium (gymnasium) that meets the standard. There were 355 secondary vocational schools (including technical schools) in the province, with 238,000 students enrolled and 730,000 students on campus; there were 641 senior high schools with 300,000 students enrolled and 864,400 students on campus, and 269,000 graduates.
There were a total of 109 ordinary universities (including independent colleges) in the province. The enrollment ratio for graduate students (including part-time students), undergraduate students, and vocational colleges was 1:4:3.8; the gross enrollment rate in higher education was 66.3%. Throughout the year, 51,477 graduate students (including part-time students) were enrolled, including 5,667 doctoral students and 45,810 master's students. There were 156,000 full-time teachers in kindergartens, an increase of 3,800 compared to the previous year; 99.99%of preschool teachers had a qualified education background. There were 369,000 full-time teachers in primary and secondary schools for compulsory education, an increase of 1.3%. There were 39,000 full-time teachers in secondary vocational education (excluding technical schools), with a student teacher ratio of 13.7:1, and 98.4% of the full-time teachers had academic qualifications. The proportion of double qualified teachers in full-time teachers and professional (skill) teachers was 44.9% and 87.2%, respectively. 43.1% of full-time teachers in ordinary higher education institutions hold titles of associate professors or above; 89.2%of teachers had a master's degree or above.
The annual research and experimental development (R&D) expenditure was 235 billion yuan, accounting for 3.02% of the GDP, an increase of 0.11% compared to the previous year [10]. 137 enterprise technology centers (including sub centers) were nationally accredited in the province. 4 provincial laboratories were newly built, totaling 10, and 4 provincial technology innovation centers were newly built, totaling 10. There were 8,174 newly accredited high-tech enterprises, with a total of 35,418 effective high-tech enterprises. 20,252 technology-based small and medium-sized enterprises were newly cultivated, totaling 98,744 so far. The total number of patent authorizations for the year was 444,000, including 61,000 invention patents, an increase of 7.9% compared to the previous year. The contribution to scientific and technological progress is expected to be 68%, and 421 "Made in Zhejiang" standards were newly established, totaling 3,029.
XI. Health, Culture and Sports
By the end of the year, there were 36,000 health institutions (including village clinics) in the province, including 1,520 hospitals, 1,046 health centers, 4,382 community health service centers (stations), 14,059 clinics (infirmaries), 11,388 village clinics, 102 disease prevention and control centers, and 100 health supervision centers. There were 615,000 health technicians, an increase of 6.3% compared to the end of the previous year, including 248,000 practicing (assistant) physicians and 268,000 registered nurses, an increase of 6.5% and 7.1% respectively. The number of beds in medical and health institutions reached 382,000, an increase of 3.2%, including 339,000 in hospitals and 19,000 in health centers. A total of 311 million patients diagnosed and treated in hospitals throughout the year, an increase of 4.1% compared to the previous year.
At the end of the year, there were 102 county-level or above public libraries, 102 cultural centers, 1,360 cultural stations, 432 museums, and 4 world heritage sites in the province. The coverage rate of county-level cultural centers and libraries reached 100%, while that of township cultural centers and village cultural rooms reached 100%. The virtual network of public libraries had basically achieved full coverage. The broadcasting population coverage rate was 99.81%, and the television population coverage rate was 99.88%. In the year, 55 films were produced and 11 films obtained public release licenses, with a box office revenue of 2.25 billion yuan. There were 15 book publishers, publishing 66 newspapers and 236 journals.
Athletes of Zhejiang Province won a total of 30 championships in national first-class competitions throughout the year. The number of people who regularly participate in physical exercise [11] (excluding students) accounted for 31.0% of the total population, and the fitness rate of urban and rural residents remained above 94.2%. As of the end of the year, there were 46 provincial-level fitness centers, 1,018 fitness squares (sports and leisure parks), and 1,537 community multi-functional sports fields. There were 18 national level sports reserve talent bases, 64 provincial-level sports reserve talent bases for the 2021-2024 cycle, 17 national level traditional sports schools and 172 Sunshine Reserve Talent Bases for provincial-level traditional sports schools in the 2019-2022 cycle. There were 38 national sports industry demonstration bases (sports and leisure demonstration zones), 3 sports tourism demonstration bases, 31 provincial-level sports and leisure bases and 30 demonstration bases for sports, leisure and tourism.
The annual sales of sports lottery tickets reached 21.79 billion yuan, an increase of 28.8% compared to the previous year.
XII. Resources, Environmental Protection and Social Security
The annual precipitation in the province was 1,556 millimeters, a decrease of 21.9% compared to the previous year and a decrease of 4.1% compared to the average annual precipitation. The province's water resources amounted to 90.8 billion cubic meters.
Throughout the year, 475,000 mu of afforestation was completed and renewed, including 86,000 mu of artificial renewal. A total of 903,000 mu of strategic reserve forests and beautiful ecological corridors was completed, including 561,000 mu of strategic reserve forests and 342,000 mu of beautiful ecological corridors. According to the annual monitoring results of forest resources in Zhejiang Province in 2022, the forest coverage rate in the province was 61.24% (including shrub forests). The completed area of soil erosion control was 420.6 square kilometers.
At the end of the year, the province had 15 new-generation weather radar stations, 15 meteorological satellite receiving stations, and 5,203 ground automatic meteorological observation stations. The average number of haze days throughout the year was 27 days. The annual average concentration of PM2.5 in the ambient air of 11 districted cities was 24 micrograms/cubic meter, the same as the previous year; the proportion of days with good air quality was 77.8% to 97.8%, averaging 89.3%.The proportion of days with good air quality in 66 county-level or above cities ranged from 77.8% to 100%, with an average of 94.2%.
Among the 296 provincial control sections, Class III and above water quality sections accounted for 97.6%, an increase of 2.4% compared to the previous year; the sections that meet the target water quality requirements accounted for 99.0%, an increase of 0.4%. According to the qualified water quantity, the water qualification rate of the main centralized drinking water sources in 11 districted cities and county-level or above cities was 100%. 99.3% of the 143 cross administrative river junction sections met the target water quality of water environment functional zones, the same as the previous year. A total of 17 red tides were found in the offshore waters, influencing a cumulative area of 1,552 square kilometers, including 1 harmful red tide, influencing a cumulative area of 20 square kilometers, without causing direct economic losses. Compared with the previous year, the number of red tides discovered decreased by 5 throughout the year, and the cumulative affected area decreased by 5,531.6 square kilometers.
The annual urban (county) sewage discharge was 4.53 billion cubic meters, with a sewage treatment capacity of 4.4 billion cubic meters and a sewage treatment rate of 97.2%, basically the same as the previous year; the harmless treatment rate of urban (county) domestic waste was 100%; the water penetration rate was 100%; the gas penetration rate was 100%.
A total of 42 national ecological civilization demonstration zones, 12 national "green" practice innovation bases, 8 provincial-level ecological civilization demonstration cities, and 81 provincial-level ecological civilization demonstration counties were established.
The total energy consumption of industries above designated size in the province increased by 11.9% compared to the previous year, and the energy consumption per unit of added value increased by 7.4%. Among them, the energy consumption of enterprises above 1000 tons of energy consumption and key monitored enterprises increased by 10.1% and 11.8% respectively, and the energy consumption per unit of added value increased by 5.4% and 5.7%, respectively.
Throughout the year, there were 861 incidents of various production accidents (including industrial and mining trade, road transportation, water transportation, fishing vessel, and railway transportation accidents), causing 707 deaths, a decrease of 31.2% and 30% respectively compared to the previous year. Among them, there were a total of 584 accidents and 439 deaths in road transportation, a decrease of 36.9% and 34.1% respectively compared to the previous year.
Notes:
[1] The data listed in this report are all preliminary annual statistical data, which shall be finalized in "Zhejiang Statistical Yearbook--2023" published by China Statistical Publishing House. Due to rounding reasons, some data may differ from the itemized total.
[2] The regional gross domestic product, the added value of three industries and related industries, and the absolute per capita regional gross domestic product are calculated at current prices, while the growth rate is calculated at constant prices.
[3] The number of the employed is expected number.
[4] The total labor productivity is the ratio of the regional gross domestic product (current price) to the annual average number of all employed people.
[5] Legal entity in the service industry with an annual operating income of 20 million yuan or more within the jurisdiction, including: transportation, warehousing and postal industry, information transmission, software and information technology service industry, water conservancy, environment and public facility management industry, and health industry. Legal entity in the service industry with an annual operating income of 10 million yuan or more within the jurisdiction, including three categories: leasing and business services, scientific research and technology services, and education, as well as four sub categories: property management, real estate intermediary services, real estate leasing operations, and other real estate industries. Legal entity in the service industry with an annual operating income of 5 million yuan or more within the jurisdiction, including: resident services, repair and other service industries, cultural, sports and entertainment, and social work.
[6] The statistical scope covers all ports.
[7] The total amount of postal business is calculated based on unchanged prices in 2020.
[8] The total amount of telecommunications services is calculated based on unchanged prices in 2021.
[9] The total number of 5G base stations is from the construction departments
[10] The expenditure for research and experimental development (R&D) in 2022 is estimated amount. According to the final verification of the 2021 GDP by the National Bureau of Statistics, the ratio of R&D expenditure to GDP in Zhejiang Province in 2021 has been revised to 2.91%.
[11] People who regularly participate in physical exercise refer to those who participate three or more times a week, exercise for more than 30 minutes each time, and exercise at a moderate or higher intensity.
Sources:
The data in this bulletin comes from the Provincial Department of Finance, the Provincial Department of Human Resources and Social Security, the Provincial Department of Agriculture and Rural Affairs, the Provincial Market Supervision Bureau (Intellectual Property Office), Hangzhou Customs, the Provincial Department of Commerce, the Provincial Department of Transportation, the Provincial Public Security Department, the Provincial Postal Administration, the Provincial Communications Administration, the Provincial Department of Culture and Tourism, People's Bank of China Hangzhou Central Branch, Zhejiang Securities Regulatory Bureau, Zhejiang Banking and Insurance Regulatory Bureau, the Provincial Department of Education, the Provincial Department of Science and Technology, the Provincial Health Commission, the Provincial Radio and Television Bureau, the Propaganda Department of the Provincial Party Committee, the Provincial Sports Bureau, the Provincial Department of Civil Affairs, the Provincial Department of Water Resources, the Provincial Forestry Bureau, the Provincial Meteorological Bureau, the Provincial Department of Ecology and Environment, the Provincial Department of Construction, the Provincial Emergency Management Department, the Provincial Medical Insurance Bureau, Zhejiang Survey Brigade of the National Bureau of Statistics, and the Provincial Bureau of Statistics.


